Microsoft Excel Stock Types - Enhance Your Financial Models with Live(ish) Stock Data
Microsoft Excel has introduced Stock Data Types (as well as Geography data types which I'll cover in a separate article). This is a 'linked data type'. Why linked? Because it is linked to an online data source, providing you with continuously updated information. Clicking Refresh will now have a whole new meaning in Excel! Let's dive in to how Stock Types work.
Where do I find Stock Types?
On the Data tab in Excel, you will now notice a new block called Data Types. In this block, you will find Stocks.

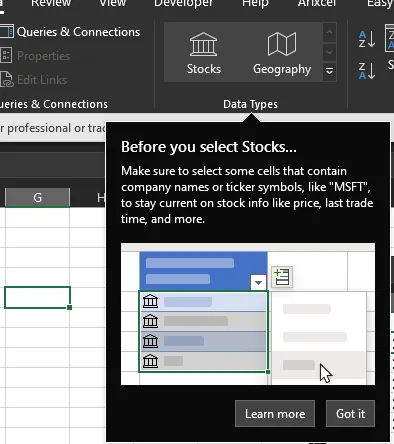
Clicking the Stocks button will give you a short description of how it works.
How do I use Stock Types?
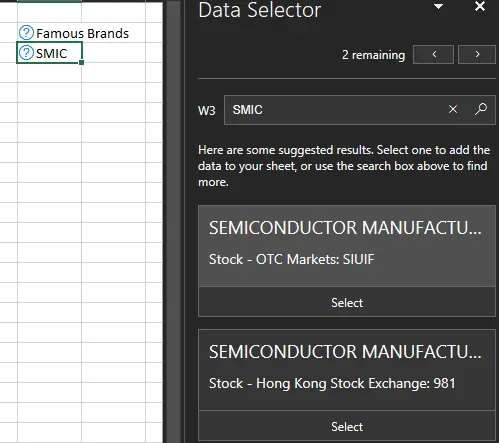
To start playing with Stock Types, just type in your list of desired company names in some cells. Now I'll say I was pretty impressed when I started typing some companies listed on global exchanges, including the Johannesburg Stock Exchange and Hong Kong Stock Exchange.
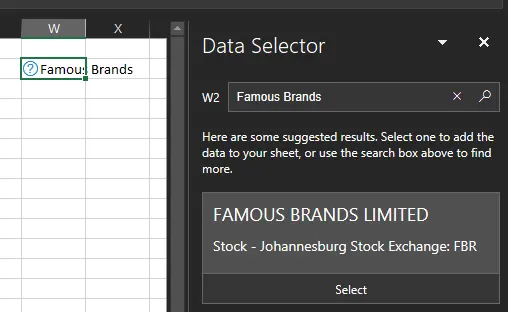
As you can see here, I tested this with Famous Brands (a South African food holdings company) and Semiconductor Manufacturing International Corporation, a Chinese semiconductor company.
This really enables one to build financial models of global portfolios using the Stock Types.
To get going, just type in the company name, head on over to the Data tab, select your company names or names (you can convert multiple fields at a time to Stock Types) and click 'Stocks'.
This will open up the Data Selector box you see on the right, where you can choose the correct company/stock.
Once you click Select, the field is changed into a Stock Type in Excel.
How do you know it's changed?
It now has the little financial institution icon (FMP named) as well as the exchange details and stock ticker in brackets next to the company name.
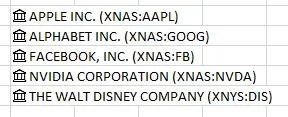
So... what can you do with an Excel Stock Type?
The Stock Types present you with a field list you can automatically add to your Excel model. When you click on a converted field, a little Field Addition button appears (again, FMP named!). When you do this, you can see a multitude of fields to add.
From the expected 52 week highs and lows to the more interesting Headquarters, Industry and Year incorporated field, you really shouldn't require more information!.
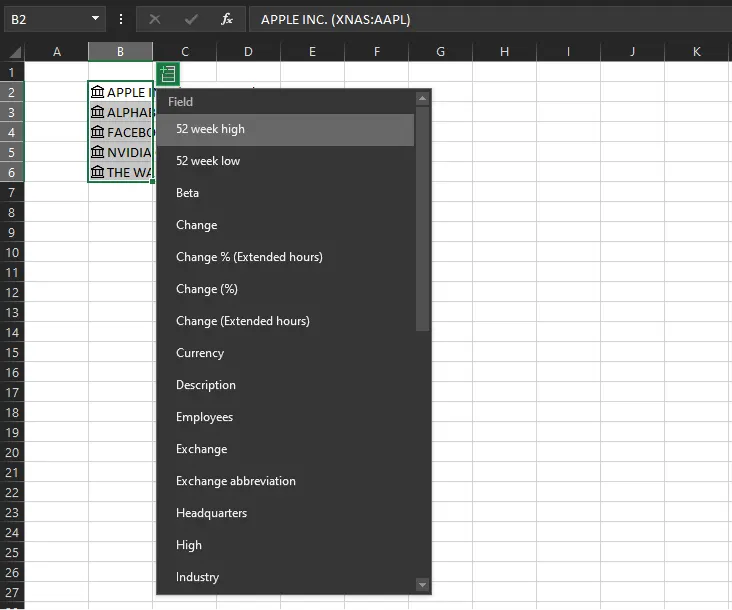
Building out a table
Adding various fields, you can then begin to create your own derived fields as well from the data Excel pulls for you.
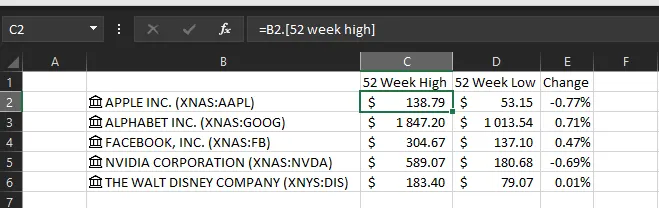
Stock Types Tooltips and Cards
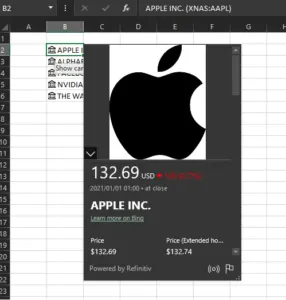
When on one of the Stock Types, you can select the icon to bring up a card with information on the stock.
Refreshing Stock Types
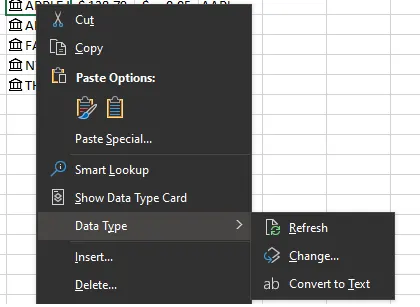
To refresh the data, just right click on the Stock Type and select Data Type, Refresh.