
Advanced Analytics and Machine Learning
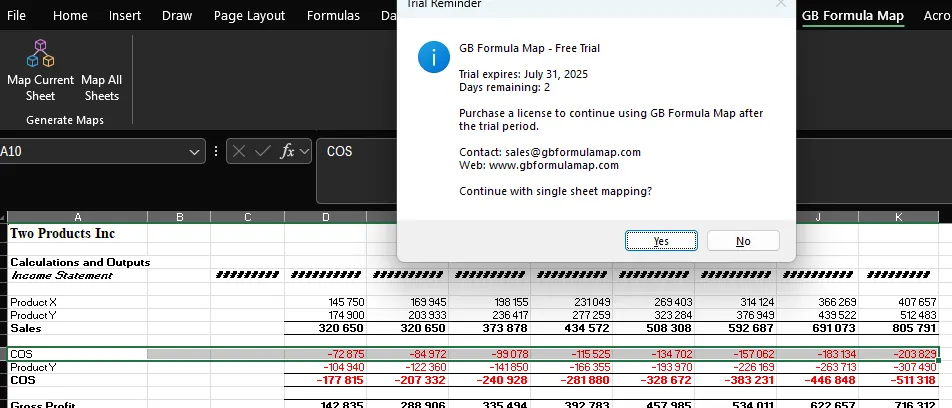
We’re excited to introduce our Formula Map Tool. This is a simple yet powerful way to see and understand your Excel model like never before.
What Is the Formula Map Tool?
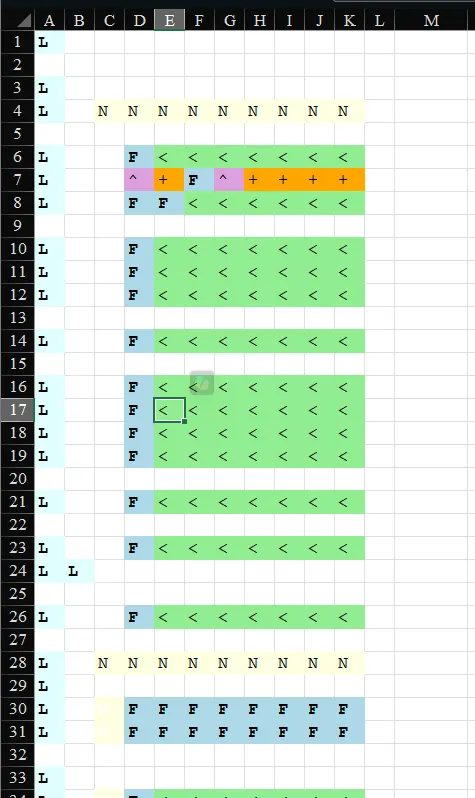
The Formula Map Tool is an Excel-based utility that visualises all the formulas in your worksheet at a glance. Instead of manually digging through rows and columns to understand model logic, the Formula Map provides a bird’s eye view of where your formulas and hardcoded values live.
Whether you're auditing a model, handing it over to a client, or diving into someone else’s workbook, the Formula Map is your instant X-ray.
How It Works
With a single click, the tool:
Scans your selected worksheet
Highlights every formula cell
Colour-codes cells
Gives you a visual grid so you can quickly spot:
Errors
Where formulas have been copied
Hardcoded inputs
Empty spaces and structure
It’s like heatmapping your Excel brain.
Why Financial Modellers Love It
Audit with Precision
Quickly find hardcoded numbers lurking in output sheets or hidden assumptions buried in helper tabs.Speed Up Reviews
Whether you’re reviewing your own model or someone else’s, the Formula Map helps you focus where it matters most.Train Junior Analysts
Help them understand how professional models are structured without endless cell-by-cell explanations.Presentation-Ready
Screenshots of Formula Maps are a great way to visually communicate model scope, logic layers, and structure to stakeholders or boards
Try It Out Today
Financial modelling should be as much about clarity as it is about calculation. The Formula Map Tool helps you build trust in your work from first formula to final forecast.
Download from Addin.World